Performance Data
Performance Status
(Millions of yen)
| 2020/3 | 2021/3 | 2022/3 | 2023/3 | 2024/3 | |
|---|---|---|---|---|---|
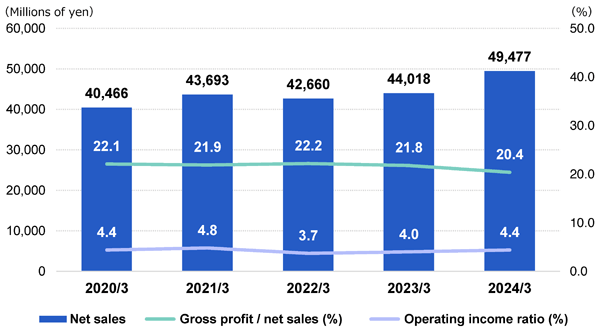
| Net sales | 40,466 | 43,693 | 42,660 | 44,018 | 49,477 |
| Cost of sales | 31,522 | 34,115 | 33,204 | 34,407 | 39,390 |
| Cost of sales / net sales (%) | 77.9 | 78.1 | 77.8 | 78.2 | 79.6 |
| Gross profit | 8,943 | 9,577 | 9,455 | 9,610 | 10,086 |
| Gross profit / net sales (%) | 22.1 | 21.9 | 22.2 | 21.8 | 20.4 |
| Selling, general and administrative expenses | 7,176 | 7,460 | 7,860 | 7,835 | 7,912 |
| Selling, general and administrative expenses / net sales (%) | 17.7 | 17.1 | 18.4 | 17.8 | 16.0 |
| Operating income | 1,767 | 2,117 | 1,595 | 1,775 | 2,174 |
| Operating income ratio (%) | 4.4 | 4.8 | 3.7 | 4.0 | 4.4 |
| Ordinary income | 1,869 | 2,242 | 1,769 | 1,813 | 2,153 |
| Ordinary income ratio (%) | 4.6 | 5.1 | 4.1 | 4.1 | 4.4 |
| Net income attributable to owners of parent | 1,091 | 304 | 1,401 | -147 | 1,379 |
| Net income attributable to owners of parent ratio (%) | 2.7 | 0.7 | 3.3 | -0.3 | 2.8 |
Notes:
1. EBITDA= Operating income + Depreciation + Amortization of goodwill
2. I Net Rely Corporation, in which all held shares were sold off from the 2nd quarter onward, has been excluded from the consolidated financial results from the fiscal year ended March 31, 2022. Japan Current Co., Ltd., in which a portion of held shares were sold off from the 4th quarter onward, has also been excluded from the consolidated financial results from the fiscal year ended March 31, 2022.
Performance Indicators
(Yen)
| 2020/3 | 2021/3 | 2022/3 | 2023/3 | 2024/3 | |
|---|---|---|---|---|---|
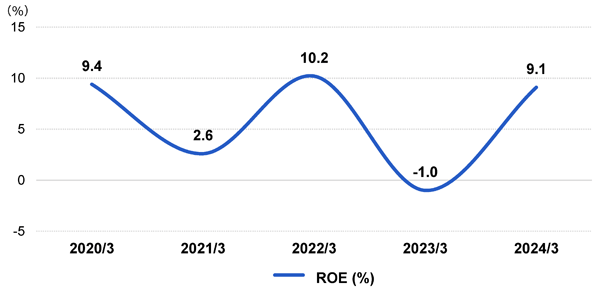
| ROE (%) | 9.4 | 2.6 | 10.2 | -1.0 | 9.1 |
| ROA (%) | 8.3 | 9.5 | 7.1 | 7.6 | 9.3 |
| Earnings per share | 42.71 | 11.92 | 53.60 | -4.88 | 45.73 |
Note:
ROE=Net income attributable to Lac Corp. / Average total stockholders' equity.
ROA=Ordinary income / Average total assets.